There is no way around it…the cost of industrial energy has been going up and most likely we will be experiencing higher costs in the foreseeable future. While you can’t control everything in business, you can and should control much more of your energy consumption patterns throughout your manufacturing operations or warehousing facilities. Energy inefficiencies are often “invisible” and therefore not apparent to the leadership of a company. Now is the time to make your operations smarter and leaner, and in so doing, less costly to operate and with less impact on the climate.
How much of your energy costs each month are actually used to power your plant? It could be less than half, with the great deal escaping through leaky air compressors, inefficient equipment, dirty water and inconsistent water flow, and other energy drains.
There are so many ways and so much technology available towards fixing these issues. Does your company have an Energy Strategy? What do you need to do in order to put an Energy Strategy into practice?
- Make sure someone, or even a small team or committee, is in charge of energy management. This is the person or persons who will have the responsibility and accountability to manage the initiative and see it through to energy-saving conclusion.
- Perform an Energy Audit by seeking the help of a professional energy specialists, and those with expertise in targeted areas. They are experts in finding all of the energy drains that are in your facility, warehouse or even offices. Part of an energy audit will quantify how much energy each department is using and will identify consumption patterns.
- The results of the Audit should identify and detail recommendations to make your plant or facility more energy efficient and productive, as well as less costly to run.
- Consider planning for scheduled and tactical shut-downs of machinery over long holiday weekends, or when there is no shift working. Doing this can substantially lower your commercial energy costs.
- HVAC systems are important for maintaining air quality and comfort in a manufacturing facility or office. But they can account for almost half of a building’s total energy costs.
We present the following simplified hypothetical example, for illustrative purposes only:
Consider a 20 Ton HVAC rooftop Air Conditioning unit (RTU), with one 3 phase compressor, operating at 460V. We’ll ignore in this example the power drawn by the condenser and evaporator fans. Running at 75% capacity or thereabouts, this compressor may draw around 35amps of current. Assuming a range of typical efficiencies of the network conditions and motor load, this corresponds to a power usage in the range of ~24kw – 27kW. We’ll assume 25kW for the sake of the example. We’ll also assume a mean duty cycle of 50% (equal time on and off) for 12 months of the year.

Considering the Demand charges as well, we assume a typical Demand cost rate of $10/kW. In our example of the single compressor, the peak Demand is, say 30kW each month (or kVA ).
Hence, Annual Elec Costs for Peak Demand charges: 30kW * $10/kW * 12 months = $3,600.00

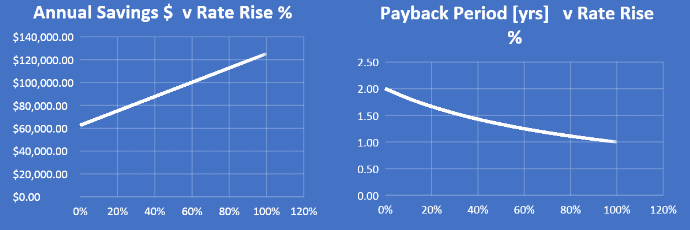
So, an investment of $5,011.20 to achieve these savings would yield a simple ROI of 50%, corresponding to a payback of 2 years, while the benefits will be in place for 10-15 years. A sound measure to take!
Now, however, let’s consider the influence of rising utility rates.
For Example:
If rates increase by 25% — 15% annual savings by investment in the same measure: $3,132.00
With a simple ROI of: 62.5%, or a simple payback of 1.6 years.
Now, from this simplified example we can extrapolate what the savings a larger building or plant might realize. We recently have been working with a dairy facility to assess the efficiency and performance of their electric distribution system and attached loads. Through voltage stabilization and power conditioning alone, analysis projects the savings to be above $65,000 annually. This is a bit more than 25 times larger than our hypothetical 20 Ton rooftop unit.
Using a multiplier of 25, and keeping the initial investment per savings the same for illustration purposes, the payback periods remain the same, but the overall savings to be realized as prices rise is accordingly much greater! See graphs below.

In the actual case of the dairy production facility, an initial payback for stage I of power optimization improvements was projected to be 2.9 years at 2021 rates. These rates have already risen, and are slated to increase significantly beyond 2022.
The Trend is Clear!
Investing sooner than later in operational efficiencies to improve your energy profile before rates continue to rise will yield financial benefits that will grow significantly with rising rates! Thought of differently, the opportunity cost of not acting will leave your overhead costs on energy and resources exposed to continued increases!
Energy LB Resources will evaluate your energy use and find ways to optimize consumption and yield of power and resources that will increase productivity, save on equipment maintenance costs, impact positively on the environment, and save money for years, offering an attractive ROI on your capital investment. Our solutions are grounded in operational data, knowledge of your plant, and a diverse set of technologies that create leaner, more economical, and more sustainable energy profiles. All while improving equipment operations.
Different utilities and billing schedules charge for Demand in different ways. Some use Real Power kW, some use Apparent Power kVA, and some have a formula based on either or both, dependent on metered usage patterns. This is a topic for a future blog!
